The Anchor-Entity Effect: How Superstar Brands Drive Sectoral Citation Concentration in Large Language Models
Alexandre Caramaschi Brasil GEO, Goiânia, Brazil ORCID: 0009-0004-9150-485X
Companion work. This paper extends the author’s prior study “Algorithmic Authority” (SSRN; Zenodo paper DOI 10.5281/zenodo.19687866; Zenodo software DOI 10.5281/zenodo.19687958), which introduced the measurement pipeline reused here.
Target venue tier: ICWSM / WWW / ACM TOIS.
Abstract
Spontaneous brand mentions in large language model (LLM) outputs are an emerging channel of economic visibility, yet systematic, longitudinal, calibrated measurement remains scarce, especially outside English-language markets. We report a complete 48-day audit, covering the full collection record from the first run to the most recent (April 23 - June 9, 2026), of spontaneous brand citation across five economy-tier LLMs (GPT-4o-mini, Claude Haiku-4.5, Gemini-2.5-pro, Perplexity sonar, Llama-3.3-70B) for four Brazilian verticals, using 48 structurally paired prompts per vertical in Portuguese and English and per-entity NER over a 127-entity cohort with fictitious decoys. Naively, fintech leads spontaneous citation at 28.15%, ahead of retail (24.94%), technology (14.50%), and healthcare (13.35%). We show this advantage is not a diffuse sectoral effect. It is dominated by a category’s top-k anchor entities. In fintech, a single anchor (Nubank) accounts for 49.7% of mentions, and 59.3% of fintech citations name Nubank exclusively. A leave-one-out recoding drops fintech to 11.46% — last place — and inverts its adjusted odds ratio from 4.13 to 0.77. Crucially, the raw fintech-retail gap dies under cluster-level inference (Welch t = 0.65, n.s.), while the leave-one-out reversal survives it (t = −3.35). The same jackknife per vertical shows every sector is anchor-driven, with fintech the extreme k = 1 case. The effect is engine-heterogeneous: only two of five engines place fintech above retail. The anchor’s within-window share grows from 41% to 57%, consistent with cumulative advantage in progress. We document measurement threats — 200-character response truncation and a 97-99% decoy false-positive rate — and specify the confirmatory protocol. All absolute rates are reported as upper bounds pending untruncated re-collection.
Keywords
generative engine optimization; LLM citation bias; anchor entity; brand concentration; cumulative advantage; sectoral bias; non-Anglophone markets; share of model; superstar firms; longitudinal audit
1. Introduction
Ask five large language models, twice a day for fifty days, which Brazilian banks, retailers, technology vendors, and health companies are worth knowing. Count how often each sector’s brands surface unprompted. One vertical wins by a clear margin. Brazilian fintech brands are cited spontaneously in 28.15% of responses, ahead of retail (24.94%), technology (14.50%), and healthcare (13.35%). The ordering is stable across eight weeks. It also matches industry folklore: vendor reports have long claimed that financial-services content earns more AI citations than technology or consumer goods. So the surface story writes itself — fintech is the favored sector, and being fintech is the advantage.
That story is wrong, and the way it breaks is the point of this paper.
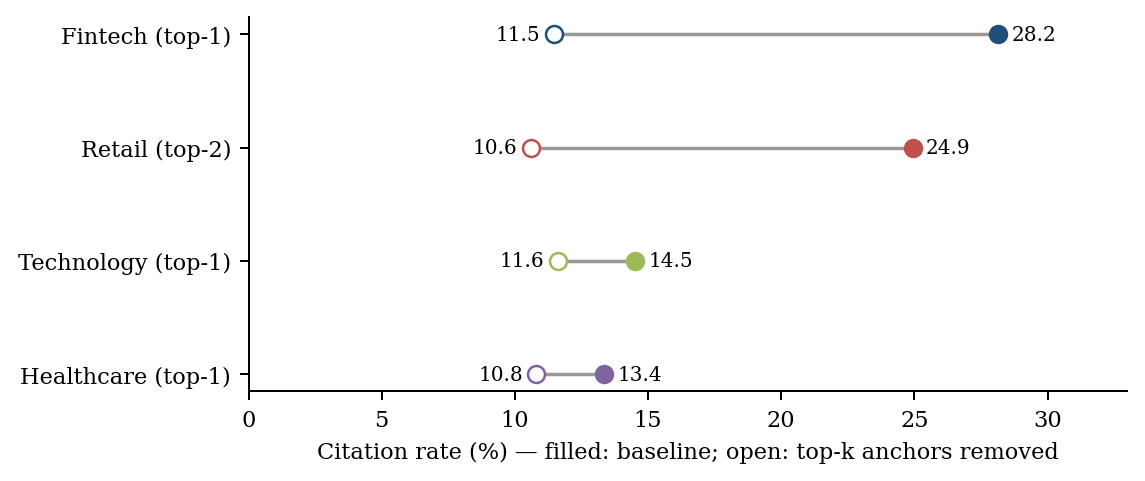
When we decompose the fintech rate by entity, almost half of it traces to one firm. Nubank accounts for 49.68% of all fintech mentions, and 59.31% of fintech responses that cite anything cite Nubank and nothing else. We then recode the outcome with a single brand removed — a leave-one-out (LOO) of the modal entity — and rerun the measurement. Fintech falls from 28.15% to 11.46%, moving from first place to last. Its adjusted odds ratio against healthcare inverts from 4.13 to 0.77, crossing the line of no effect and changing sign. The apparent sectoral advantage was the shadow of one brand.
This is the anchor-entity effect. A category’s spontaneous-citation rate is governed not by a diffuse property of the sector but by its top-k anchor entities — the brands that occupy the category’s semantic slot. Item-level popularity bias, when a category has produced a single dominant firm, surfaces as an apparent sectoral advantage. The leave-one-out estimator separates the two. Fintech is the extreme single-anchor (k = 1) case, but the mechanism generalizes: applied per vertical, the same jackknife shows every sector is anchor-driven, and retail, a two-anchor category, falls 14.35 points once both Mercado Livre and Magazine Luiza are removed.
The explanatory question is worth stating plainly, because it is what the decomposition answers. Why does fintech get more citations? Not because fintech is privileged as a vertical. Because Brazilian fintech produced the country’s strongest anchor entity. “Nubank” maps almost one-to-one onto “Brazilian digital bank” — a brand evoked across the most category entry points and carried by a lexically unique, clean name. Anchor concentration then masquerades as sectoral advantage. The vertical is an epiphenomenon. The anchor is the asset.
Two findings sharpen the claim and guard it against the obvious objection that we have rediscovered popularity bias under a new name. First, the raw fintech-retail gap of 3.2 points does not survive correct inference. Treating the roughly 240 query-by-engine clusters as the unit, a per-cluster Welch test gives t = 0.65 (not significant): the variance between prompts swallows the gap. The leave-one-out reversal, by contrast, survives the same clustering at t = −3.35, and is stable across all eight weeks. The fragile claim dies exactly where it should; the robust one holds. Second, the anchor’s share is not static. Nubank’s within-fintech share rises from roughly 41% in weeks 16-18 to 53-59% in weeks 19-23 — a relative gain near 30% inside the measurement window itself. The rich get richer during the experiment, which is cumulative advantage caught in motion rather than inferred after the fact.
This paper makes four contributions.
A construct. We formalize the anchor-entity effect as a falsifiable construct, separating the anchor entity (an item), anchor concentration (a sector property, the pair of a Herfindahl index and the leader’s share), and the anchor effect (the transmission, measured as the leave-one-out drop Δᵥ). An entity is the sector’s anchor only if its share clears a pre-registered threshold τ and leads the runner-up by a margin δ. This makes “having an anchor” discrete and testable, and it ports an established mechanism — cumulative advantage, a convex map from market share to citation share — onto the parametric attention of LLMs.
A diagnostic. The leave-one-out of a sector’s modal entity is a construct-validity test for the entire “sectoral bias” literature. Any claim that LLMs favor sector X should survive removal of X’s modal brand, lest it measure a firm rather than a sector. We provide the estimator and demonstrate the failure mode on the strongest available case.
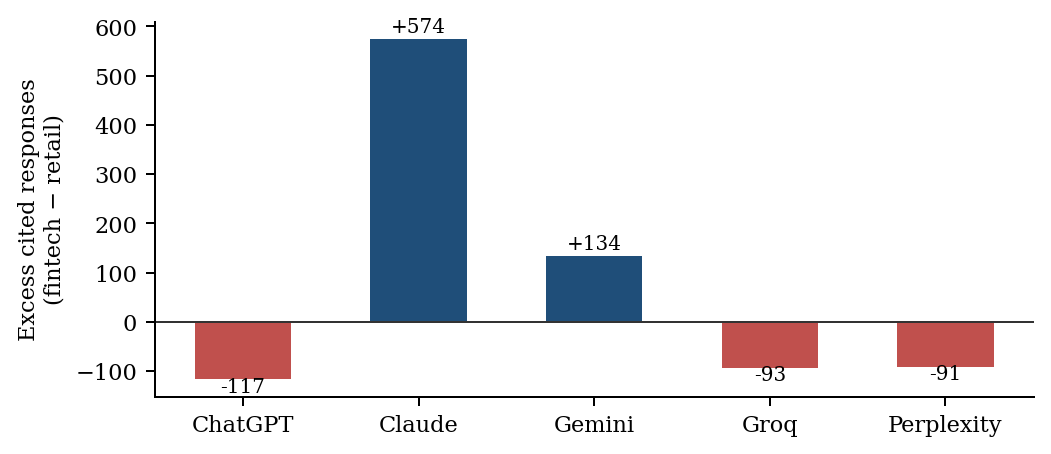
An engine result. Sectoral systematicity is false across engines. Only two of five engines place fintech above retail; the aggregate advantage comes almost entirely from one parametric engine (Claude Haiku, +574 cited responses) plus a truncation artifact (Gemini, +134), against three engines pointing the other way. The engine matters more than the sector.
A measurement lesson. We surface and quantify the threats any spontaneous-citation audit must confront. Response text was truncated to 200 characters in four of five engines, so the detector measured front-loading rather than full citation, and that truncation inflates the anchor’s apparent concentration by erasing late-appearing rivals. Fictitious decoys triggered a 97-99% false-positive rate. We treat both as open threats, report every absolute rate as an upper bound, and specify the dual-track recollection and clustered-inference protocol required for confirmatory claims.
A note on scope. Four of five engines are economy-tier models, the snapshot covers the complete collection record from the first to the most recent run (April 23 - June 9, 2026), and the market is single and non-Anglophone. We do not generalize to flagship models, and we name no brand evaluatively: high citation does not imply quality, and low citation does not imply deficiency. The measurement is observational, and any bias it surfaces is attributed to the model, not to the conduct of the firms measured.
2. Related Work
Our work sits at the intersection of four literatures that, individually, are mature, and that no prior study has combined. Generative engine optimization (GEO) explains what gets cited at the document level: the founding KDD work introduced GEO-bench and visibility levers such as citing sources and adding statistics (Aggarwal et al., 2024); follow-ups learn engine preferences automatically (AutoGEO; Zhong et al., 2026) and isolate topical relevance and list position as the drivers of being cited first (Vishwakarma et al., 2026), with multi-vertical, multi-language designs confirming a strong earned-media bias (Chen et al., 2025). A second stream audits which sources AI engines cite at scale — tens of thousands of conversations mapping citations to news domains (Yang, 2025) — and links page-level features to citation through frameworks like GEO-16 (Schockaert et al., 2026). A third explains why the engine axis dominates our matrix: under retrieval, models lean almost exclusively on retrieved context rather than the parametric prior (Sun et al., 2024), so a RAG engine resamples the long tail that a parametric engine collapses onto whatever pre-training consolidated. A fourth treats popularity and salience: even when they know the fact, LLMs favor shortcuts — entity popularity, mention order, co-occurrence — more so in smaller models (Lehmann et al., 2026), though one study finds LLM recommenders less popularity-biased than classical systems (Lichtenberg et al., 2024), and brand bias carries a country-of-origin component relevant to a Portuguese-language, Brazil-local prompt design (Kamruzzaman et al., 2024). Investment-recommendation work documents an analogous winner-take-most concentration of capital in a few firms (productbias2025investment).
We depart from prior work on popularity bias along two axes. Prior work operates at the item level: popular entities are favored when models compare or recommend (Lehmann et al., 2026; Lichtenberg et al., 2024), and recent audits show that citation of source domains is more concentrated in LLM search engines than in traditional ones (Zhang et al., 2025). First, our unit of concern is the category, not the item or the domain: we show that an item-level popularity bias, when a category has produced a single superstar firm, surfaces as an apparent sectoral citation advantage, and we provide a leave-one-out estimator of the anchor effect (Δᵥ) that separates the two. Second, we treat the anchor decomposition as a construct-validity test for the broader “sectoral bias” literature: any claim that LLMs favor sector X should survive removal of the sector’s modal entity, lest it measure a firm rather than a sector.
The closest neighbor in measuring citation concentration is Zhang et al. (2025), “Source Coverage and Citation Bias in LLM-based vs. Traditional Search Engines” (arXiv:2512.09483, December 2025). Across 55,936 queries over six LLM search engines and two traditional ones, they report that fewer than ten distinct URLs appear in 80% of responses — tighter concentration than traditional search. The contrast with our study is exact, and mandatory. They measure concentration of source domains; we measure concentration of commercial brands within a category. Their design is cross-sectional; ours is longitudinal. They study an Anglophone setting; we study a non-Anglophone emerging market. Domain coverage is long-tailed, which is why “even the most-cited domain rarely exceeds 5%” recurs in industry analyses. Within-category brand attention, the object we measure, is winner-take-most. The two coexist, and conflating them is the error our decomposition guards against.
A growing body of industry analyses reports that financial-services content is cited more often than technology or consumer-goods content, and popularizes “share of model” as the AI-era successor to share of voice. We treat these as motivation rather than evidence: they lack statistical testing, entity-level decomposition, longitudinal design, and peer review, and they conflate source-domain concentration — which is long-tailed (Zhang et al., 2025) — with within-category brand concentration, which we show is winner-take-most. The raw ranking, fintech above technology, is therefore folklore, not contribution. Our contribution is to formalize the latter as a measurable construct (anchor entity / anchor effect) and to test it across engines and over time.
We bridge three literatures absent from prior GEO and LLM-bias work. From marketing science, the Ehrenberg-Bass account of mental availability — brands evoked across many Category Entry Points and retrieved via Distinctive Brand Assets (Sharp, 2010; Romaniuk & Sharp, 2022) — gives a falsifiable reading of why a single brand becomes the category’s anchor: it predicts that within-category citation share tracks survey-measured mental availability. “Nubank” is mental availability at its ceiling plus a clean verbal Distinctive Brand Asset. From economics, the theory of superstar firms (Autor et al., 2020) and digital winner-take-most dynamics supplies the upstream mechanism by which market concentration becomes corpus concentration. From sociology, cumulative advantage and the Matthew effect (Merton, 1968; DiPrete & Eirich, 2006), recently applied to LLM substrates such as AI programming assistants, formalizes the convex, super-linear mapping from market share to citation share that distinguishes an anchor effect from mere concentration. The anchor entity is thus not a new phenomenon in isolation but the projection of cumulative advantage onto the parametric attention of LLMs — a contribution that ports an established mechanism to a new substrate and measures it.
What no prior study combines is the full design: longitudinal, multi-engine (one RAG-native and four parametric), multi-sector with formal between-vertical comparison, in a non-Anglophone emerging market, over real commercial entities rather than news domains or hypothetical brands, with decoy calibration and a public dataset. Each neighbor covers one to three of these axes; none covers them together. That intersection, together with the anchor-entity construct and its leave-one-out diagnostic, is where our contribution lives.
Section B — Methods (Data, Measurement, Statistical Approach, Threats, Ethics)
3. Data and Measurement
We audit spontaneous brand citation in large language model outputs across five
engines and four verticals of the Brazilian market. Collection is automated. A
GitHub Actions workflow issues two scheduled runs per day, sending each prompt to
every engine and persisting the raw response, the engine identifier, the model
version string, the query metadata, and the named-entity extraction result into a
single SQLite store (papers.db). The workflow has run continuously since the
opening of the confirmatory window; the analysis reported here covers the complete
collection record, from the first run (April 23, 2026) through the most recent (June 9, 2026).
The five engines and their exact model versions, as recorded in the
model_version field of every row, are: ChatGPT (gpt-4o-mini-2024-07-18),
Claude (claude-haiku-4-5), Gemini (gemini-2.5-pro), Perplexity (sonar), and
Groq (llama-3.3-70b). Four of the five are economy-tier variants. We scope every
claim accordingly and do not extrapolate to flagship models; this restriction is a
validity boundary, not an aside (see Section on Threats to Validity).
3.1 Verticals, roster, and entity cohort
The four verticals are fintech, retail, technology, and healthcare, all in the Brazilian market. Detection runs against a cohort of 127 entities: 79 real Brazilian entities, 32 international anchors, and 16 fictitious decoys. The decoys are invented names that should almost never be cited; they exist to probe detector specificity. The roster effectively evaluated per vertical — the real Brazilian brands whose mentions enter the rate — is unbalanced by design: fintech carries 19 entities, while retail, technology, and healthcare carry 15 each. We flag this asymmetry rather than hide it. A larger roster mechanically raises the chance that some brand appears, so per-entity normalization is reported alongside per-response rates (Section on Statistical Approach), and on the per-roster-entity metric retail (0.01662) already exceeds fintech (0.01482).
Entity-to-vertical allocation is a clean partition: zero entity strings appear in more than one vertical. No string leaks across verticals. The partition is nonetheless an analyst decision — Mercado Pago is coded only in fintech and Mercado Livre only in retail, although both belong to the same economic group; iFood is coded only in technology. We declare this allocation as a design degree of freedom.
3.2 Query design
Each vertical is probed by 48 distinct queries. The 48 are generated from a single
shared set of templates, with only the vertical-naming phrase swapped between them.
The design is balanced: 8 queries per query_category (comparative, trust,
discovery, experience, innovation, market) in every vertical, and 24 directive
against 24 exploratory in every vertical, split across Portuguese and English.
Paired examples illustrate the parallelism: “Como está estruturado o mercado de
fintechs e bancos digitais no Brasil?” against the structurally identical retail
and healthcare variants.
One property of the design we report as a verified strength, because it neutralizes the most obvious objection. None of the 48 queries in any vertical contains the name of a roster brand — 0 of 48 in all four verticals, confirmed by direct inspection of the query table. There is no construct leakage through the prompt wording: the questions do not induce the brands they are testing for. Reviewers should weigh this against the looser practice common in the literature, where vertical is operationalized as a prompt variation rather than as a fully paired, brand-free template.
Each query is repeated roughly 293 times over the window (two daily runs across the days, engines, and languages). This repetition structure defines the cluster geometry that governs inference and is treated explicitly below.
3.3 Extraction (NER v2)
A named-entity recognition pass (NER v2, recorded as cited_v2) marks, per
response, whether any roster entity was cited. The detector supports alias matching
(via_alias_count_v2) and folding (via_fold_count_v2). Items outside the analysis
core — adversarial probes (is_probe) and calibration items (is_calibration) — are
excluded. The analysis core is defined as is_probe=0 AND is_calibration=0 AND
extraction_version='v2'.
3.4 Window and sample sizes
The confirmatory window (v2) runs from 2026-04-23 to 2026-07-21. This report is the
a full snapshot through June 9, 2026, with the collection program still active. The raw sample is
n=62,820. The analysis core is n=50,453, with cited_v2=10,218, a global citation
rate of 20.25%. Per-vertical core sizes are fintech 12,648, retail 12,648,
technology 12,547, and healthcare 12,610. Per cell of the vertical-by-engine matrix
the count is roughly 2,832, except Perplexity at roughly 1,416, which was collected
at half cadence.
3.5 Public dataset and provenance
The analysis is reproduced by scripts that read papers.db directly:
_run_stats.py and _run_stats2.py print every number in the results tables,
extract_analysis.py regenerates the quantitative summary, and run_waves.sh
orchestrates the external model board. Because collection is commit-driven, every
observation carries collection-day provenance, and the rate series can be
reconstructed week by week. The frozen dataset, the analysis code, and the public
dump are to be released with SHA-256 manifests; those manifests are not yet
materialized and are tracked as a submission blocker (see Ethics, Data
Availability and Reproducibility).
3.X Measurement caveat — response truncation
One measurement fact constrains every absolute rate in this paper and we state it
plainly. The response_text field was persisted truncated at exactly 200
characters for four of the five collectors. Direct inspection of
LENGTH(response_text) confirms it: ChatGPT, Claude, and Gemini show 100% of rows
at exactly 200 characters (11,328 / 11,194 / 10,939 rows respectively); Perplexity
is the exception, ranging from 198 to 2,502 characters with a mean of 722 and 0% of
rows at exactly 200.
The consequence for the construct is precise. NER v2 ran over the opening snippet,
not the full response. What cited_v2 measures, for four of five engines, is
whether a brand appears in the first roughly 200 characters — citation in the
response opening, or front-loading — not full citation propensity. Engines that
open with rhetorical preamble are penalized: a real Gemini retail response cuts mid-
word at “volume de v[endas]” before any brand appears. The destroyed text cannot be
recovered from storage, so the bias is not correctable in the current data; a dual-
track re-collection that persists the full text and re-runs the NER is running until
window close (2026-07-21), with about six weeks of integral collection before the
window ends.
The Perplexity full-text subset bounds the bias rather than removing it. Measured on the untruncated engine, the fraction of citations whose first entity name appears after character 200 — exactly the citations truncation would destroy — is 20.5% for fintech, 20.9% for retail, 30.7% for healthcare, and 51.6% for technology. The direction matters and corrects an earlier reading. Truncation does not reward fintech by front-loading; it penalizes the rivals, erasing over half of technology’s citations and nearly a third of healthcare’s against about a fifth of fintech’s and retail’s. The fintech-versus-technology and fintech-versus-healthcare gaps are therefore partly an artifact of the cut, while the fintech-versus-retail gap (both near 20%) is not. Truncation also inflates within-fintech anchor dominance, because tail brands surface late (PicPay at 515, Banco Inter at 838 characters) and are cut before they register; the 49.68% Nubank share must accordingly be read as an upper bound until integral re-collection lands.
Statistical Approach
The observation unit is the binary outcome cited. The naive specification treats
all 50,453 responses as independent, which is false. Each of the 48 queries per
vertical is repeated roughly 293 times across two daily runs, days, engines, and
languages, so the effective sample is on the order of 48 queries × 5 engines ≈ 240
clusters, not 50,453 trials. A chi-square that ignores this overstates precision
grossly: the fintech-versus-retail contrast reads χ²=33.6, p=6.8×10⁻⁹ under i.i.d.,
but aggregating to the 48 query-clusters per vertical and running a Welch test on
the per-cluster means gives t=0.645 (df≈94), not significant — the between-query
standard deviation (about 24 percentage points) swallows the 3.2-point gap. We
therefore report the surface fintech advantage as a descriptive observation, not as
an inference.
The principal model is a logistic generalized linear mixed model (GLMM) with random intercepts for query and for collection day (ideally also for engine), estimating
logit P(cited=1) = β₀ + β₁·vertical + β₂·llm + β₃·query_category + β₄·query_lang + (1 | query) + (1 | collection_day),
with references vertical=healthcare, llm=ChatGPT, category=comparative. Odds ratios
are reported as exp(β) with profile 95% intervals. Cluster-robust standard errors
(by query and by engine) and a query-cluster bootstrap serve as robustness checks.
The model is run with a dual outcome: cited_v2 and cited_loo, the latter
recoding as not-cited every fintech response whose only entity is the anchor. The
odds-ratio inversion for fintech (adjusted OR 4.13 to 0.77) belongs in the body, not
an appendix, because that inversion — unlike the surface gap — survives clustering
(Welch t=−3.353 on per-cluster LOO means) and is stable across all eight weeks (LOO
gap −7.6 to −8.2 percentage points).
Wilson intervals are reported for description only, never as the basis for the inferential claim. A jackknife / leave-one-out protocol is run per vertical, not only for Nubank: Mercado Livre and Magazine Luiza for retail, Totvs for technology, and Hypera and EMS for healthcare, with confidence intervals on the drops themselves so that the asymmetry of fragility (fintech falls 16.70 points; the others 2.55–5.67) is itself tested rather than asserted. Engine heterogeneity is handled with Mantel-Haenszel common odds ratios stratified by category (fintech vs retail, M-H OR=1.205) and a Breslow-Day test of homogeneity, which rejects (χ²=25.42, 5 df, p=0.0001), justifying the vertical-by-category interaction term. Multiple-comparison correction (Holm/FDR) is applied over the 4×5×6=108 tested cells and the pairwise contrasts. Power is assessed at the cluster level (~240), not the observation level, because that is where the near-vertical reversals under LOO can still shift before the window closes at day 90.
Threats to Validity
We organize threats by type and state the mitigation status of each.
Construct validity. The dominant threat is the 200-character truncation: for
four of five engines cited_v2 measures front-loading, not full citation.
Mitigation is the integral re-collection running to window close; until it lands,
every absolute rate is read as a potential truncation artifact (status: unresolved,
re-collection in progress). The decoy false-positive rate is catastrophic — fictitious
brands are “found” in 96.94%–98.61% of probe cases across verticals — so detector
specificity is near zero on that test. The mitigation is to determine and document
whether the high false-positive rate is by design (a decoy planted in the prompt to
test obedience, hence not comparable to spontaneous citation) or a detector bug
requiring correction (status: unresolved, audit pending; the board briefing’s claim
of “low decoy FPR” is overruled by the verified database). Alias matching applies
unequal leniency across verticals (healthcare 991 alias hits, technology 4), so the
construct partly reflects annotator alias curation; mitigation is to report strict-
match rates beside alias-inclusive rates (status: planned). Self-report validation
from the dual_responses table is available but unused in the main analysis
(status: planned as cross-validation).
Internal validity. The unbalanced roster (19 vs 15) mechanically favors fintech; mitigation is per-entity normalization, already showing retail above fintech, plus fixed-size roster resampling (status: partially addressed). Brand selection is neither blind nor preregistered, risking circularity — choosing citable brands and concluding the vertical is citable; mitigation is to document, ideally preregister, the selection criterion (status: to document). Single-entity dependence is the central internal threat and the paper’s pivot: removing Nubank drops fintech from 28.15% to 11.46%, from first to last place. This is reframed as the contribution — anchor-entity concentration — rather than treated as a defect to be corrected (status: prototyped via LOO, generalized to all verticals).
External validity. Four of five engines are economy-tier; results do not
generalize to flagships. Mitigation is to scope the claim explicitly to economy-tier
models and declare exact model_version strings (status: scoped). Each engine is a
single frozen version with no cross-version replication, so temporal validity is
limited (status: declared as limitation; an optional cross-version probe is proposed
if budget allows). The causal narrative — corpus density, category brands — is
post-hoc: no corpus-size, news-share, or search-volume measure was crossed with the
rate. Mitigation is to present the mechanisms as hypotheses with discriminating
tests, not established causality (status: reframed).
Statistical conclusion validity. Non-independence inflates intervals and p-values: the effective n is ~240 clusters, and p<10⁻¹⁵⁰ denotes “highly significant” under a false i.i.d. assumption, not literal precision. Mitigation is the clustered GLMM and multiple-comparison correction described above (status: designed). Engine heterogeneity is itself a threat to the aggregate claim: only two of five engines (Claude, Gemini) place fintech above retail, the aggregate gap is largely a Claude- Haiku idiosyncrasy (+574 cited responses) plus a Gemini truncation artifact (+134), and Gemini’s zeros are themselves measurement artifacts (preamble cut before the brand). Mitigation is to elevate engine heterogeneity to a first-order finding, to report direction per engine, and to remove or re-collect Gemini (status: reframed; Gemini decision pending). The anchor-entity share, the central metric, is also threatened by truncation, which cuts late-appearing tail brands and exaggerates Nubank’s dominance; the 49.68% share is therefore an upper bound pending integral re-collection (status: declared).
Ethics, Data Availability, and Reproducibility
This is an observational measurement study. It measures the frequency of spontaneous brand mention in public LLM output; it does not recommend brands, audit product quality, or confer endorsement. We state explicitly that high citation does not imply product superiority and that low citation does not imply deficiency. The measured bias is a property of the models and their training corpora, not conduct by the named companies: the manuscript reads “model X cites Nubank,” never “Nubank is more citable because it is better.” No proprietary data and no material non-public information are used; every entity is named solely because it appears in public LLM output. Subjects are legal persons, not natural persons, and the mentions derive from public output, so no personal data is processed and LGPD does not apply — we declare this rather than leave it implicit. Anonymization would be counterproductive: it would destroy the contribution (the Nubank case is the paper) without reducing real risk, since the thesis concerns a mechanism favorable to all brands. We therefore name entities, with the ethics framing above, and we declare no competing interests.
The dataset and protocol are released publicly so that any named brand can reproduce
and contest the result, which serves as a factual right of reply. The dataset is
deposited at Zenodo (DOI 10.5281/zenodo.19687866) and the analysis software at Zenodo
(DOI 10.5281/zenodo.19687958); the open repository is at
github.com/alexandrebrt14-sys/papers, and the corresponding author’s ORCID is
0009-0004-9150-485X. The reproducibility package is incomplete at this stage,
and we list the gaps as binding: SHA-256 manifests for the frozen papers.db, the
scripts, and the public dump; a versioned dataset with a data dictionary; the NER
codebook (per-vertical alias table, folding rules, disambiguation criterion), without
which the alias asymmetry is not auditable; the roster selection protocol; and an
environment lock for the analysis scripts. These are scheduled before submission and
the dataset continues to accrue in the ongoing collection program; subsequent snapshots will extend this record.
4. Results
All estimates below derive from the confirmatory window of papers.db (62,820 raw observations; analytic core n = 50,453 after excluding adversarial probes and calibration items, extraction version v2). This snapshot covers the complete collection record to date (April 23 - June 9, 2026); absolute rates and the anchor concentration figure should be read as upper bounds pending the integral re-collection described in §3 of the Methods. Where inference treats responses as independent, we flag the assumption explicitly and report the cluster-level test that supersedes it.
4.1 An apparent sectoral advantage
At face value, fintech is the most cited vertical. Across the analytic core, spontaneous citation rates rank fintech (28.15%) above retail (24.94%), technology (14.50%), and healthcare (13.35%); the global rate is 20.25% (Table 1). Treating each response as an independent trial, the fintech−healthcare contrast is large: a risk difference of +14.80 percentage points (pp) (95% CI +13.82 to +15.78) and an adjusted odds ratio of 4.13 (95% CI 3.81–4.47) under the fixed-effects logistic model (reference vertical = healthcare; LLM = ChatGPT; query category = comparative; McFadden pseudo-R² = 0.339). The fintech−retail contrast is smaller — RD +3.22 pp (95% CI +2.13 to +4.31), OR 1.18 (95% CI 1.115–1.247) — but still nominally positive. The weekly series (W16–W23) shows this ordering never inverts, which the draft read as temporal robustness
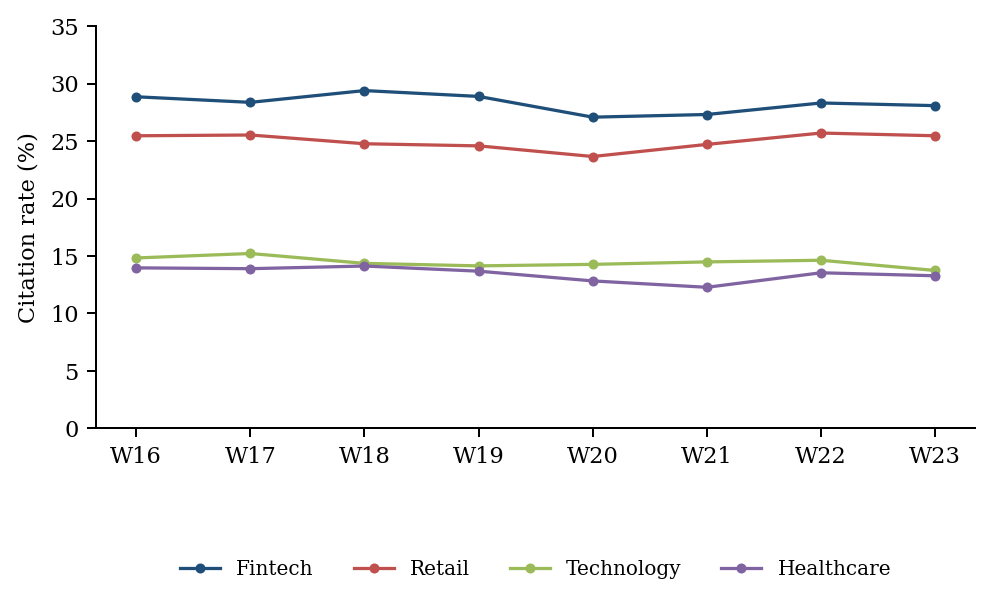
.
That reading is the hypothesis this section dismantles. The aggregate ordering is genuine at the level of the marginal mean, but its attribution to the vertical does not survive decomposition.
Table 1. Spontaneous citation rate by vertical (analytic core, Wilson 95% CI).
| Vertical | n | Cited | Rate (%) | 95% CI (%) |
|---|---|---|---|---|
| Fintech | 12,648 | 3,561 | 28.15 | 27.38 – 28.95 |
| Retail | 12,648 | 3,154 | 24.94 | 24.19 – 25.70 |
| Technology | 12,547 | 1,819 | 14.50 | 13.89 – 15.12 |
| Healthcare | 12,610 | 1,684 | 13.35 | 12.77 – 13.96 |
| Total | 50,453 | 10,218 | 20.25 | — |
4.2 Decomposition reveals anchor concentration
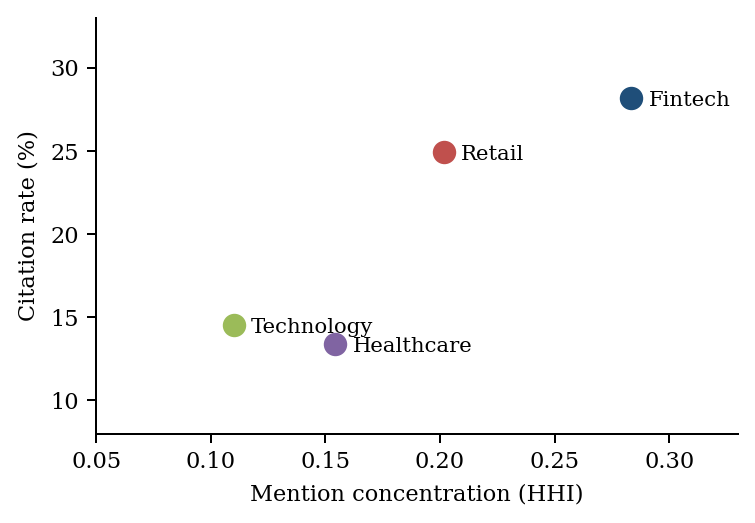
The fintech rate is concentrated in a single entity. Nubank accounts for 3,533 of the 7,112 entity mentions in fintech (49.68%), and 2,112 of the 3,561 cited responses (59.31%) name Nubank and no other roster entity. Citation concentration tracks citation rate across the four verticals: the Herfindahl index falls fintech (0.283) > retail (0.202) > healthcare (0.154) > technology (0.110), mirroring the rate ordering and consistent with a cumulative-advantage account rather than a diffuse sectoral property
. We caution that the 49.68% concentration is itself an upper bound: under 200-character truncation (§4.5), fintech’s tail anchors are recorded late — Itaú at 402 chars, PicPay at 515, Banco Inter at 838, BTG at 906 — while Nubank’s first mention sits at a mean offset of 118 chars, so truncation mechanically inflates the anchor’s apparent dominance within the vertical.
Recoding as “not cited” every fintech response whose only named entity is Nubank (leave-one-out, LOO) drops the fintech rate from 28.15% to 11.46% (95% CI 10.91–12.02), moving it below all three other verticals — a complete reversal of the ranking (Table 3). In the logistic model the adjusted fintech-vs-healthcare odds ratio inverts from 4.13 to 0.77 (95% CI 0.70–0.84); the LOO outcome also fits the structural covariates marginally better (pseudo-R² rises from 0.339 to 0.352), suggesting the genuine vertical and engine signal lives in the anchor-free data
.
4.3 Cluster-robust inference kills the raw gap but confirms the LOO reversal
The naive contrasts above treat ~293 repetitions per query as independent; the effective design has ~48 query-clusters per vertical. Aggregating the citation rate to the query-cluster level (48 clusters per vertical, ≥30 observations each) and applying a Welch test between cluster means, the raw fintech−retail gap does not survive. Fintech averages 26.51% per cluster and retail 23.30%, but the between-query standard deviation is ~24 pp, yielding Welch t = 0.65 (df ≈ 94) — not significant. The 3.2-pp surface gap is swallowed by between-query variance, so “fintech has the highest rate” must be reported as a descriptive observation, not a statistically detected effect.
The reversal behaves in exactly the opposite way. Running the same cluster-level Welch test on fintech’s LOO rate (10.50% per cluster) against raw retail (23.30%) gives t = −3.35 — significant and negative. The fragile finding (sectoral advantage) collapses where it should; the robust finding (anchor dominance, now expressed as a reversal) holds at the cluster level. The reversal is also temporally stable: the fintech−retail gap under LOO (both verticals’ anchors removed) is negative in all eight weeks, ranging narrowly from −7.6 to −8.2 pp, which rules out the objection that the reversal is driven by particular weeks.
4.4 Anchors exist in every vertical (top-k generalization)
Applying the single-top-entity jackknife to each vertical shows that all four are anchor-driven, with the drop scaling with concentration (Table 3). Removing the top entity costs fintech 16.70 pp (Nubank), but only 5.67 pp for retail (Mercado Livre), 2.89 pp for technology (Totvs), and 2.55 pp for healthcare (Hypera). Read this way, fintech looks uniquely fragile. The asymmetry is real but not yet formally tested with a confidence interval on the difference of drops, which we flag as required confirmatory work.
The single-entity comparison is, however, the wrong unit for retail, which has a dual-anchor structure: Mercado Livre and Magazine Luiza together account for 58% of mentions. Removing both top-2 anchors drops retail from 24.94% to 10.59% — a fall of 14.35 pp, comparable in magnitude to fintech’s. The top-3 share already signalled this and was under-exploited: fintech 70.9% versus retail 69.4%. The defensible contribution therefore generalizes not as “a single superstar” but as top-k anchor concentration that varies by vertical, with fintech the extreme k = 1 case and retail the k = 2 case
.
Table 3. Leave-one-out and per-vertical jackknife (analytic core).
| Vertical | Anchor(s) removed | Anchor share | Original rate (%) | Rate after removal (%) | Drop (pp) |
|---|---|---|---|---|---|
| Fintech | Nubank | 49.7% | 28.15 | 11.46 | −16.70 |
| Retail | Mercado Livre | 29.5% | 24.94 | 19.27 | −5.67 |
| Retail | Mercado Livre + Magazine Luiza | 58% | 24.94 | 10.59 | −14.35 |
| Technology | Totvs | 24.8% | 14.50 | 11.60 | −2.89 |
| Healthcare | Hypera | 24.7% | 13.35 | 10.80 | −2.55 |
Fintech LOO rate carries a Wilson 95% CI of 10.91–12.02%. Confidence intervals on the per-vertical drops are not yet computed and are required for confirmatory comparison of the asymmetry.
4.5 Engine heterogeneity
The “sectoral” effect is not consistent across engines; it is largely one engine’s idiosyncrasy plus one artifact. Only two of five engines place fintech above retail in raw rate: Claude Haiku (51.0% vs 30.7%) and Gemini (4.9% vs 0.0%, in a near-floor regime contaminated by truncation). ChatGPT (18.1% vs 22.2%), Groq (8.7% vs 12.0%), and Perplexity (86.5% vs 92.9%) all run the other way (Table 2). Decomposing the aggregate fintech−retail gap into excess cited responses per engine, Claude contributes +574 and Gemini +134 (truncation artifact), against ChatGPT −117, Perplexity −91, and Groq −93
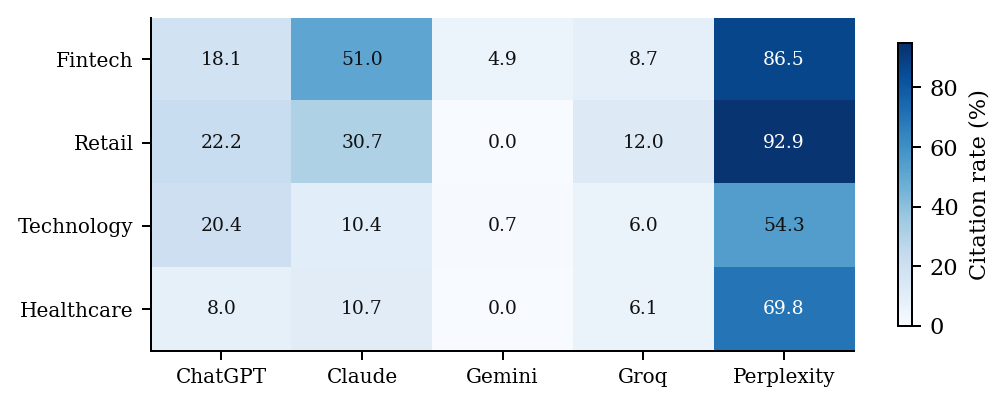
. The engine effect dominates the marginal model: Perplexity carries an OR of 12.12 (95% CI 11.12–13.21) versus ChatGPT, while Gemini sits at 0.061 (95% CI 0.052–0.072). Because Perplexity is a retrieval-augmented (RAG) engine that saturates near the ceiling (up to 92.9%) and Gemini near the floor, reporting the RAG and parametric engines as a single headline rate conflates two construct regimes; excluding Perplexity, the fintech rate is 20.80%. The cleanest parametric signal is the 40-pp Claude gap (fintech 51.0% vs technology 10.4%), which localizes the effect in the model weights rather than in live retrieval.
A sanity check in the integral (untruncated) Perplexity subset confirms the anchor effect is not a truncation artifact: fintech LOO falls to 67.9%, still below retail’s 92.9%, whereas retail, technology, and healthcare have LOO rates equal to their originals (the RAG engine rarely cites the anchor alone). This validation rests on only ~24 query-clusters per vertical — half the prompt diversity of the truncated engines — and so is under-powered; we report it as supporting rather than confirmatory.
Table 2. Vertical × LLM citation rate (%, analytic core).
| Vertical | ChatGPT (gpt-4o-mini) | Claude (haiku-4.5) | Gemini (2.5-pro) | Groq (llama-3.3-70b) | Perplexity (sonar) |
|---|---|---|---|---|---|
| Fintech | 18.1 | 51.0 | 4.9 | 8.7 | 86.5 |
| Retail | 22.2 | 30.7 | 0.0 | 12.0 | 92.9 |
| Technology | 20.4 | 10.4 | 0.7 | 6.0 | 54.3 |
| Healthcare | 8.0 | 10.7 | 0.0 | 6.1 | 69.8 |
Cell n ≈ 2,832, except Perplexity ≈ 1,416 (collected at half cadence, with 24 distinct queries per vertical against 48 in the other engines).
A related measurement threat concerns truncation direction. Response text was persisted at exactly 200 characters in four of five engines; only Perplexity is integral. Measured on the integral engine, retail front-loads more than fintech (mean first-entity offset 111.1 vs 123.1 chars), with healthcare (159.9) and technology (173.3) latest — so the draft’s claim that truncation “rewards fintech for front-loading” is empirically false. Truncation instead penalizes the rivals: it would erase 51.6% of technology citations and 30.7% of healthcare citations whose first entity appears after char 200, against ~20% for fintech and retail. Truncation therefore inflates the fintech-vs-technology and fintech-vs-healthcare gaps (the +14.80-pp and +13.66-pp contrasts of Table 4 are partly an artifact of the cut) but not the fintech-vs-retail gap
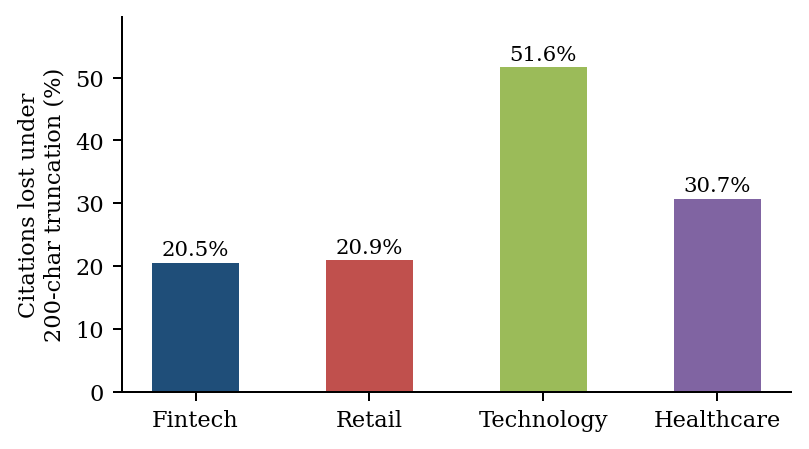
.
4.6 Temporal intensification
The anchor is not stable within the measurement window — it is intensifying. Nubank’s share of fintech mentions rises from ~41% (W16–W18) to ~53–59% (W19–W23), an interim peak of 59.2% in W20, and the sole-Nubank fraction of cited responses climbs in parallel from 53.5% to 66.7%
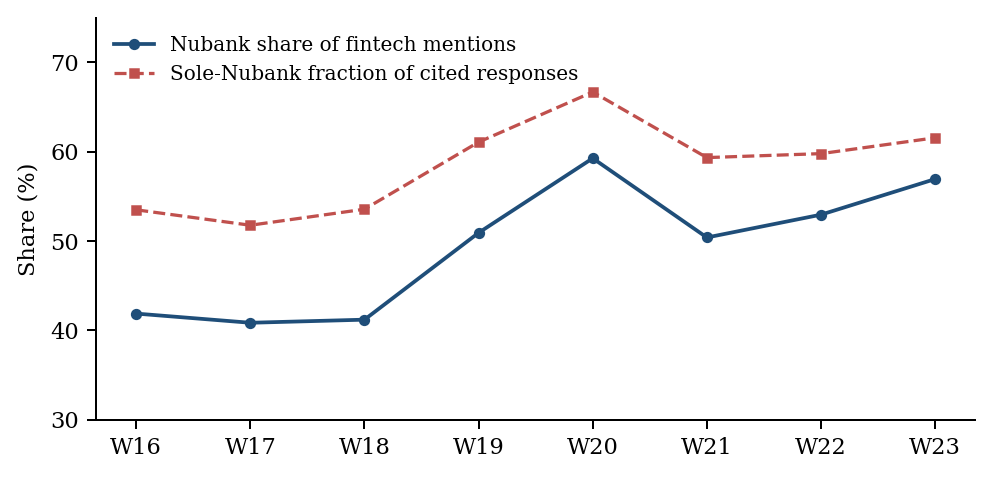
. The aggregate fintech rate stays flat (~27–29% across the eight weeks) precisely because the tail (PicPay, C6, Inter) contracts while the anchor grows, so the marginal is held fixed by compensation rather than by stability. The draft measured the stable quantity (the vertical’s rate) and missed the moving one (anchor concentration). We therefore read the within-window growth as a service-drift threat to temporal validity for the anchor construct, to be tracked in subsequent snapshots, and treat the aggregate’s apparent stability as a compensating artifact rather than evidence of robustness.
A Mantel–Haenszel summary stratifying the fintech-vs-retail contrast by the six query categories gives a common OR of 1.205, but the Breslow–Day homogeneity test rejects (χ² = 25.42, 5 df, p = 0.0001): stratum ORs range from 1.04 (discovery) to 2.29 (experience), so the common OR carries a vertical × category interaction and still embeds the Nubank effect on the original outcome. Under LOO the sign inverts, consistent with §4.3. We report the M–H estimate with this caveat rather than as a pooled effect.
Table 4. Effect sizes, naive (response-level) vs cluster-level inference.
| Quantity | Estimate | 95% CI / test |
|---|---|---|
| RD fintech − healthcare (original) | +14.80 pp | +13.82 to +15.78 pp |
| RD fintech − retail (original) | +3.22 pp | +2.13 to +4.31 pp |
| OR fintech vs healthcare, adjusted (original) | 4.13 | 3.81 – 4.47 |
| OR fintech vs healthcare, adjusted (LOO) | 0.77 | 0.70 – 0.84 |
| OR Perplexity vs ChatGPT | 12.12 | 11.12 – 13.21 |
| OR Gemini vs ChatGPT | 0.061 | 0.052 – 0.072 |
| Welch t, fintech − retail gap (cluster-level) | 0.65 | df ≈ 94; not significant |
| Welch t, fintech-LOO − retail (cluster-level) | −3.35 | significant, negative |
| Nubank share of fintech mentions | 49.68% | upper bound (truncation) |
| Sole-Nubank fraction of fintech citations | 59.31% | — |
Response-level CIs are Wald/Wilson and are optimistically narrow because they treat 50,453 responses as independent; the cluster-level Welch tests are the inferential statements of record for the two gap contrasts. A confirmatory GLMM with random intercepts for query, day, and engine, dual outcome (cited_v2 and cited_loo), and cluster bootstrap is specified for the final window.
5 The Anchor-Entity Effect: A Formal Account
The empirical regularity this paper sets out to explain is simple to state and easy to misread. Across the analytic core (n = 50,453), the fintech vertical attains spontaneous citation in 28.15% of responses, ahead of retail (24.94%), technology (14.50%), and healthcare (13.35%). Read at face value, this is a sectoral advantage. Our claim is that it is not. It is the projection of a single dominant firm onto the category average, and naming that projection precisely is what turns a description into a construct.
5.1 Three objects, not one
Prior treatments conflate three distinct objects. We separate them. Let s(e, v) denote the share of mentions captured by entity e within vertical v, that is s(e, v) = mentions(e, v) / mentions(v).
The anchor entity of a vertical is the modal firm e* = argmax s(e, v), but only when it clears two pre-registered thresholds: a share floor, s(e*, v) ≥ τ, and a separation from the runner-up, s(e*, v) − s(e₂, v) ≥ δ. With τ = 0.40 and δ = 0.15, the definition is discrete and falsifiable rather than circular. Fintech qualifies: Nubank holds 49.68% of fintech mentions with a wide gap to second place. Retail does not: its leader Mercado Livre sits near 29.5%, below τ, with Magazine Luiza close behind. Retail is a two-leader category, not a single-anchor one — a distinction the thresholds make formal rather than rhetorical.
Anchor concentration is the pair (HHIᵥ, s(e*, v)). Reporting the Herfindahl index alone is insufficient, because it cannot distinguish “concentrated around one” (fintech) from “concentrated around a few” (retail). The share of the modal entity is what carries that information.
The anchor effect, the quantity the thesis turns on, is the difference between the observed citation rate and the counterfactual rate under leave-one-out (LOO) removal of the anchor: Δᵥ = rate(v) − rate_LOO(v). For fintech, Δ = 28.15 − 11.46 = 16.69 points. This is the clean operationalization of the “superstar component” of an apparent sectoral rate.
5.2 The convex cumulative-advantage mechanism
Concentration alone does not distinguish an anchor effect from ordinary popularity bias. The missing piece is a functional claim about how market presence becomes citation. We posit that the probability of spontaneous citation is a convex transform of an entity’s relative frequency in the training corpus, which is in turn a convex (cumulative-advantage) transform of its real market share:
P(cite e | v) ≈ g( f(e) ),   f(e) ∝ m(e)^γ   with γ > 1
g convex and saturating (logistic in the parametric weights)
Because γ > 1, the mechanism predicts super-linear over-representation: a firm holding, say, 30% of a market should capture closer to half of its category’s mentions. This is the Matthew effect — cumulative advantage in the sense of Merton (1968) and DiPrete & Eirich (2006) — ported to a new substrate, the parametric attention of LLMs. The anchor entity is thus not a novel phenomenon in isolation; it is what cumulative advantage looks like when it is projected onto model weights, with the upstream concentration supplied by winner-take-most dynamics in digital markets (Autor et al., 2020) and the canonical-brand reading supplied by mental availability theory (Sharp, 2010; Romaniuk & Sharp, 2022).
5.3 Five falsifiable predictions and their status
The construct yields five predictions, ordered by the strength of the test available in the present data.
P1 (LOO inversion). Removing the anchor inverts the sector’s rank. Confirmed. Fintech falls 28.15% → 11.46%, from first to last, and its adjusted odds ratio versus healthcare inverts from 4.13 to 0.77. The reversal survives cluster-level inference (Welch t = −3.35 on per-cluster means, against t = 0.65 for the fragile raw gap) and holds across all eight observed weeks (LOO gap between −7.6 and −8.2 points throughout).
P2 (convex over-representation). s(e*, v) exceeds the firm’s true market share. Testable, not yet run. This is the decisive test of γ > 1 and requires crossing the 49.68% citation share against Nubank’s actual Brazilian market share.
P3 (engine gradient). The anchor effect is larger in purely parametric engines, where γ acts on the weights, than under RAG, where live retrieval resamples the tail. Supported. Claude shows a 40-point parametric gap (51.0% fintech vs 10.4% technology); under Perplexity the gap compresses, with fintech-LOO at 67.9% — still below retail’s 92.9%, but the retriever no longer lets the anchor stand alone.
P4 (anchor specificity / negative control). Verticals without an anchor (retail, which does not reach τ) do not invert under removal of any single leader. Testable, with a leading signal: the LOO of a single entity drops retail only −5.67 points versus fintech’s −16.70; removing retail’s two anchors together drops it −14.35, confirming that every vertical is anchor-driven and fintech is the extreme k = 1 case.
P5 (mental availability). s(e*, v) correlates with survey-measured brand mental availability. Future work — the bridge to Ehrenberg-Bass that would most raise the paper from measurement to theory; no published study has crossed mental availability with LLM citation.
6 Why Fintech? Mechanisms Behind the Apparent Sectoral Advantage
The aggregate phenomenon is real: fintech does lead spontaneous citation, and the ordering of concentration (HHI 0.283 > retail 0.202 > healthcare 0.154 > technology 0.110) tracks the ordering of citation rate closely. The error is not in seeing the phenomenon but in attributing it to a diffuse property of the sector. The aggregate is produced by four chained mechanisms, not by a sectoral spirit. We set them out in causal order and close by stating what each explains and what it cannot.
6.1 Layer (i): the sector produced the country’s strongest anchor entity
Brazilian fintech generated, in Nubank, the strongest anchor entity in the national market, through a conjunction no other vertical assembles at the same intensity.
Category brand (maximal mental availability). “Nubank” occupies the semantic slot of “Brazilian digital bank” almost one-to-one — it is the canonical answer evoked across the largest number of the category’s entry points (opening an account, a no-fee card, a bank on the phone, a first card). In Ehrenberg-Bass terms it is the brand most likely to be retrieved across the most Category Entry Points.
Lexically unique name (verbal distinctive brand asset). “Nubank” is a rare, unambiguous string, unlike “Amazon,” “Oracle,” or “Google,” which suffer NER false negatives and positives and dissolve into other senses. A unique name maximizes both corpus salience and extractability.
Scale and external validation. The anchor’s offline scale is independently documented: Nubank listed on the NYSE in December 2021 in one of the year’s largest fintech IPOs (CNBC, 2021), and by March 2026 reported surpassing 115 million customers in Brazil, making it the country’s largest private financial institution by customer count (Nu Holdings, 2026). The within-category citation share we measure (49.7%) nonetheless far exceeds any plausible market-share figure, which is precisely the convexity the construct predicts.
Narrative infrastructure (Pix / Open Finance). Instant payment and open-banding rails gave the sector a dense national narrative in which the brand sits glued to the category, multiplying the category’s entry points. Alongside it runs a high-cadence text stream that names the brand daily — specialized press, comparison and consumer content, aggressive native-digital SEO, and institutional documentation from the Central Bank. Honest caveat: we did not measure corpus volume. This corpus-supply layer is a candidate upstream hypothesis, not established causation, and its direct predictions failed — the effect was not maximal under RAG (retail 92.9% > fintech 86.5%) and the fintech–technology gap was larger in English, not Portuguese. We report these as refutations, not partial confirmations.
6.2 Layer (ii): entity → category transmission via cumulative advantage
This is the theoretical core. Popularity bias is an item-level phenomenon; what we measure is the transmission of that item-level bias into an apparent property of the category. The mechanism is cumulative advantage: because the market-share-to-citation-share map is convex (γ > 1), a single firm captures a disproportionate slice of the category’s mentions, and the category average inherits the firm’s dominance. The live evidence of transmission in progress is that the anchor’s share grows within the measurement window itself: Nubank rises from about 41% (W16–W18) to roughly 53–59% (W19–W23), a relative increase near 30% over fifty days. The rich get richer inside the experiment. This is also why the vertical’s headline rate looks stable while the thesis quantity does not: the tail (PicPay, C6, Inter) shrinks as the anchor grows, holding the aggregate fixed by compensation while concentration climbs. The apparent sectoral advantage is, literally, one superstar firm’s shadow cast across the category mean.
6.3 Layer (iii): amplification by parametric engines
Transmission is not uniform across engines, which is precisely why “systematic sectoral bias” is false. In purely parametric models γ acts directly on the weights: Claude cites fintech at 51.0% against 10.4% for technology — a 40-point gap that is the strongest and least anecdotal evidence in the study, because it shows the advantage lives in the weights, not in live retrieval. Decomposing the aggregate fintech–retail gap by engine confirms the asymmetry: Claude contributes +574 cited responses and Gemini +134 (the latter contaminated by truncation), against ChatGPT −117, Perplexity −91, and Groq −93. The aggregate advantage is almost entirely one parametric engine plus one artifact, against three engines pointing the other way. Under RAG, Perplexity resamples the tail and compresses the gap. The engine matters more than the sector.
6.4 Layer (iv): the opening-window measurement artifact
Part of the headline number is a property of the instrument and the moment. The NER ran over the first ~200 characters in four of five engines, measuring front-loading rather than full citation. This cut does not reward fintech for being front-loaded — retail front-loads more (mean first-entity offset 111.1 vs 123.1 characters). It penalizes the rivals: truncation would erase 51.6% of technology citations and 30.7% of healthcare citations, whose entities appear late, against ~20% for fintech and retail. It therefore inflates the fintech–technology and fintech–healthcare gaps but not the fintech–retail gap. Within fintech, the cut also exaggerates Nubank’s dominance (offset 118, inside the window) by erasing tail anchors that surface late (Itaú 402, PicPay 515, Inter 838, BTG 906 characters). Compounded with the fact that the snapshot captures the opening of the phenomenon, when cumulative advantage is still accelerating, this means 28.15% and 49.68% are upper bounds pending untruncated recollection.
6.5 Discriminating-evidence table
| Observed pattern | (i) Anchor entity | (ii) Cumulative advantage | (iii) Parametric amplification | (iv) Window artifact |
|---|---|---|---|---|
| Fintech rate leads aggregate | partial | explains | partial | inflates vs tech/health only |
| LOO inversion 28.15 → 11.46% | explains | explains | — | does not explain |
| HHI/top-3 highest in fintech | explains | partial | — | inflates Nubank’s share |
| Anchor share grows 41% → 57% in-window | — | explains | — | fails to explain |
| Claude 40-pt parametric gap | reinforces | reinforces | explains | does not explain |
| Only 2/5 engines rank fintech top | fails to explain | fails to explain | explains | partial |
| Gap larger in English than PT | reinforces (global entity) | — | — | fails to explain |
| Tech/health citations appear late | — | — | — | explains |
| Retail front-loads more than fintech | — | — | — | explains (refutes the draft’s claim) |
No single layer explains every pattern. Layer (i) is necessary but cannot explain the engine variance or the in-window growth. Layer (ii) explains the rate and the growth but not the engine heterogeneity. Layer (iii) explains the heterogeneity but not the concentration ordering. Layer (iv) explains the late-citation asymmetry and the inflated gaps but is silent on the parametric signal. The parsimonious account is the chain, not a winner.
6.6 Correlational versus identified
We state the epistemic status plainly, because the contribution depends on it.
Identified (within the data, robust to clustering). The anchor effect itself: that removing the modal entity inverts the fintech rank (P1), that the inversion survives cluster-robust inference and is stable across all eight weeks, and that the per-vertical jackknife shows every sector is anchor-driven with fintech the extreme k = 1 case. The engine heterogeneity (Layer iii) is also identified — it is a direct observation of the vertical × engine interaction, not an inference about the world. The directional correction of the front-loading narrative (Layer iv) is measured on the untruncated Perplexity cohort.
Correlational or unmeasured. The corpus-supply story (Layer i, the press/SEO/Reclame Aqui/Central Bank chain) is an untested upstream hypothesis: no measure of corpus size, news volume, or search volume was crossed with citation rate, and its own direct predictions were refuted. The convex over-representation claim (P2) is not yet tested against real market share, so γ > 1 remains posited rather than demonstrated. The mental-availability bridge (P5) is future work. The anchor’s offline scale (NYSE listing in December 2021; 115M+ customers in Brazil reported in March 2026) is documented in public filings and company disclosures, but the mapping from offline scale to citation share remains correlational. In short: the decomposition and the engine heterogeneity are identified results; the upstream causal chain that would explain why fintech produced the anchor in the first place remains a disciplined hypothesis, not a finding. ```
The Anchor-Entity Effect — Sections 7–8 and Consolidated References
Closing sections of the manuscript. All quantities are taken from the verified reviewer analyses over
papers.db; all citations are drawn only from entries confirmed inliteratura.md,peer_review_R2_teoria.md, and the author’s companion-work record. Data cover the complete collection record (April 23 - June 9, 2026) and every absolute rate is reported as an upper bound pending the dual-track recollection.
7. Discussion
The headline of this study is not that one Brazilian vertical out-cites the others. It is that the question “which sector do LLMs prefer?” is, on inspection, malformed. When we asked it of our data, the data answered with a single firm. Fintech leads spontaneous citation at 28.15%, ahead of retail (24.94%), technology (14.50%), and healthcare (13.35%); recode as uncited every fintech response whose only named entity is Nubank, and the vertical falls to 11.46% — dead last — while its adjusted odds ratio against healthcare inverts from 4.13 to 0.77. A “sectoral advantage” that does not survive the removal of one brand was never an advantage of the sector. This is the first lesson for anyone measuring brand visibility in LLMs: the unit that the field reports (the category) and the unit that actually carries the signal (the anchor entity) are not the same, and conflating them manufactures findings that evaporate under decomposition.
We propose the leave-one-out of the modal entity as a routine validity check, not a robustness afterthought. The estimator is cheap — recode, re-tabulate, compare — and it discriminates sharply: under per-cluster inference, the raw fintech-retail gap is not significant (Welch t = 0.645 across 48 query-clusters per vertical, the ~24-point between-query variance swallowing the 3.2-point gap), whereas the leave-one-out reversal is (t = -3.35, negative sign). The fragile claim dies exactly where it should and the robust one survives. We therefore advance a general prescription: any claim that an LLM favors sector X should be required to survive removal of X’s modal entity, lest the study be measuring a firm and reporting a sector. The anchor lens generalizes beyond fintech — jackknifing each vertical’s top entity drops retail by 5.67 points, technology by 2.89, healthcare by 2.55, and fintech by 16.70; remove retail’s two co-leaders (Mercado Livre plus Magazine Luiza) and retail falls 14.35 points. Every vertical is anchor-driven. The difference between fintech and the rest is the number of anchors (one versus two or more), not the presence of concentration. Fintech is simply the extreme k = 1 case, and the construct is the top-k anchor core, not a Nubank curiosity.
Engine heterogeneity is the second first-class finding, and it is destructive of the “systematic sectoral bias” framing. Only two of five engines place fintech above retail. The aggregate gap decomposes into +574 cited responses from Claude Haiku and +134 from Gemini — the latter contaminated by truncation — against ChatGPT (-117), Perplexity (-91), and Groq (-93). The “sector effect” is, almost entirely, one parametric model’s idiosyncrasy plus an artifact, opposed by three engines pointing the other way. A brand’s GEO reality is therefore not a single number; it is a vector over engines. Strong visibility in Claude does not transfer to ChatGPT or Perplexity, and a study that averages across engines reports a fiction that holds for none of them. We treat the vertical-by-engine interaction as a primary result and recommend that visibility be measured engine by engine.
The third contribution is methodological, and it is the part most transferable to
other sectoral audits. Two measurement threats shaped — and partly fabricated —
our raw numbers. First, response_text was persisted truncated at exactly 200
characters in four of five collectors (only Perplexity intact), so the NER scored
front-loading in the opening of the answer rather than full citation. This does
not reward fintech for early mention — retail front-loads more (first-entity
offset 111 versus 123 characters) — it penalizes rivals whose anchors arrive late:
truncation erases 51.6% of technology citations and 30.7% of healthcare, against
~20% for fintech and retail, inflating the fintech-versus-technology gap while
leaving the fintech-versus-retail gap untouched. Worse for the thesis metric,
truncation inflates the within-fintech concentration itself: Nubank sits at offset
118 (inside the window) while Itaú (402), PicPay (515), Banco Inter (838), and BTG
(906) fall outside it, so the 49.68% concentration figure is itself partly a
truncation artifact and must be declared an upper bound. Second, fictitious decoy
brands were “found” 96.9–98.6% of the time; until we determine whether this
false-positive rate is by design (a decoy planted in the prompt, hence not
comparable to spontaneous citation) or a detector defect, the construct validity
of cited carries an asterisk. Decoy design and truncation auditing are not
housekeeping — they are the difference between measuring citation and measuring an
opening-sentence heuristic, and we report them as such.
Finally, honesty about what the current data cannot yet support. We cannot make confirmatory rate claims: the inference is not yet clustered (the published chi-squared values treat ~293 repetitions per query as independent, when the effective n is ~240 clusters), and that work is pending. We cannot claim temporal stability of the anchor: Nubank’s share rises within the window, from ~41% (W16– W18) to 53–59% (W19–W23), a ~30% relative increase that is a service-drift threat, not a robustness result — the aggregate rate looks stable only because the tail shrinks as the anchor grows. We cannot yet test the mechanism’s signature prediction, that citation share exceeds real market share (the convex, super-linear mapping), because we have not crossed the 49.68% citation share with Nubank’s actual Brazilian market share. And the corpus-supply story — that fintech’s dense Portuguese-language press, comparison, and institutional corpus feeds the anchor — remains an untested upstream hypothesis whose own predictions (largest effect under RAG; larger gap in Portuguese) were in fact refuted by the data. What survives, robustly, is the decomposition: the apparent sectoral advantage is the shadow of a category’s anchor core, modulated more by engine than by sector.
7.X Implications for Generative Engine Optimization
If the vertical is an epiphenomenon and the anchor is the asset, the practical counsel for brands inverts the prevailing intuition. Being in the “right” vertical buys nothing; being the category’s anchor buys a disproportionate share of the model’s attention. Nubank captures 49.68% of fintech mentions, and 59.31% of fintech responses that cite anyone cite Nubank alone. The objective of GEO is not to “appear” — it is to become the category entity, the default name a model emits when the category is evoked. A brand that becomes the canonical answer to a class of questions captures attention out of all proportion to its share of the market that produced it.
Two entity-level levers follow directly. Entity disambiguation and lexical uniqueness matter: “Nubank” is a rare, clean string with no competing senses, unlike “Amazon,” “Oracle,” or “Google,” which suffer NER false negatives and positives and dilute into other meanings. A unique name maximizes both salience in the corpus and extractability by the detector — a verbal distinctive brand asset in the Ehrenberg-Bass sense, paired with mental availability: the anchor is the brand evoked across the largest number of category entry points (“open an account,” “no-fee card,” “bank on your phone”). Consensus density across sources is the second lever. The vertical’s tail is itself robust — PicPay, C6, and Inter sum to roughly 2,065 mentions — so non-anchor brands still capture meaningful attention by building presence in high-cadence Portuguese-language corpora: specialized press, comparison and consumer sites, and institutional documentation (Banco Central, Pix, Open Finance). A brand that recurs consistently across many independent sources accrues the cumulative advantage that the parametric weights later encode.
For the Brazilian market specifically, the opportunity is in the fragmented categories. Technology B2B (HHI 0.110) has no consolidated anchor; it is precisely where a brand can still become the category entity through directed corpus investment. Already-anchored categories such as fintech are defense for the leader and an uphill attack for everyone else. Sensitive categories play by different rules: in healthcare, RLHF pushes toward generic, hedged answers (0% negative mentions, heavy hedging), so GEO there competes not on brand salience but on being the citable institutional source that survives the caution guardrail. Across all categories, the engine matters more than the sector — visibility must be measured engine by engine — and honest measurement is itself a competitive edge: a serious GEO program reports within-category citation share per entity and per engine, with and without the anchor, and separates RAG from parametric behavior, because the “sectoral advantages” the industry sells are fragile to a single firm and to measurement artifacts.
8. Conclusion
We set out to explain why Brazilian fintech brands appeared most cited by large language models and found that the premise dissolved under decomposition. The apparent sectoral advantage is not a property of the sector. Recoding away a single anchor entity drops fintech from first place to last (28.15% to 11.46%) and inverts its adjusted odds ratio (4.13 to 0.77); the same leave-one-out, applied to every vertical, shows each is governed by its top-k anchor core, with fintech the extreme single-anchor case. The contribution is the construct and the estimator that go with it: the anchor entity (defined by a share threshold and a gap to the runner-up), anchor concentration (the Herfindahl index together with the anchor’s share), and the anchor effect — the rate that a vertical loses when its anchor is removed — read as the projection of cumulative advantage onto the parametric attention of LLMs, and modulated more by engine than by sector.
We do not claim more than the current data support. The rates are upper bounds until recollection removes the 200-character truncation and restores the full 48-query Perplexity arm; the inference awaits a clustered model at the ~240-cluster level; the decoy false-positive rate awaits a definitive design-versus-bug verdict; the convex over-representation prediction awaits a market-share contrast. The roadmap to window close on 21 July 2026 runs a dual-track recollection (intact text in parallel with the historical truncated series, to quantify exactly how much the cut distorts each vertical), a logistic GLMM with random intercepts for query, day, and engine and dual outcomes, per-vertical top-k leave-one-out with confidence intervals over the drops, and the reproducibility package — SHA-256 manifests, a versioned public dataset, and the NER codebook. The finding we expect to carry to the final window is the one already robust to clustering: sectoral citation advantage in LLMs is, in large part, anchor-entity concentration.
References
Aggarwal, P., Murahari, V., Rajpurohit, T., Kalyan, A., Narasimhan, K., & Deshpande, A. (2024). GEO: Generative Engine Optimization. In Proceedings of the 30th ACM SIGKDD Conference on Knowledge Discovery and Data Mining (KDD) (pp. 5–16). DOI: 10.1145/3637528.3671900. arXiv:2311.09735.
Autor, D., Dorn, D., Katz, L. F., Patterson, C., & Van Reenen, J. (2020). The Fall of the Labor Share and the Rise of Superstar Firms. Quarterly Journal of Economics, 135(2), 645–709. DOI: 10.1093/qje/qjaa004.
Caramaschi, A. (2026). Algorithmic Authority: A Practitioner Framework for Generative Engine Optimization Based on a 7-Day Implementation Sprint. SSRN. DOI: 10.2139/ssrn.6460680. Also archived as preprint on Zenodo, DOI: 10.5281/zenodo.19687866.
Caramaschi, A. (2026). alexandrebrt14-sys/papers: v0.1.0 [Software]. Zenodo. DOI: 10.5281/zenodo.19687958.
Chen, M., Wang, X., Chen, K., & Koudas, N. (2025). Generative Engine Optimization: How to Dominate AI Search. arXiv:2509.08919.
CNBC (2021, December 9). Buffett-backed Nubank rises in trading on the NYSE in blockbuster IPO. https://www.cnbc.com/2021/12/09/buffett-backed-nubank-rises-in-trading-on-the-nyse-in-blockbuster-ipo.html.
DiPrete, T. A., & Eirich, G. M. (2006). Cumulative Advantage as a Mechanism for Inequality: A Review of Theoretical and Empirical Developments. Annual Review of Sociology, 32, 271–297. DOI: 10.1146/annurev.soc.32.061604.123127.
Kamruzzaman, M., Nguyen, H. M., & Kim, G. L. (2024). “Global is Good, Local is Bad?”: Understanding Brand Bias in LLMs. In Proceedings of EMNLP 2024. arXiv:2406.13997.
Lehmann, H. H., Lee, J. H., Schockaert, S., & Wermter, S. (2026). Knowing the Facts but Choosing the Shortcut: Understanding How Large Language Models Compare Entities. EACL 2026. arXiv:2510.16815.
Lichtenberg, J. M., Buchholz, A., & Schwöbel, P. (2024). Large Language Models as Recommender Systems: A Study of Popularity Bias. In Gen-IR Workshop at SIGIR. arXiv:2406.01285.
Merton, R. K. (1968). The Matthew Effect in Science. Science, 159(3810), 56–63. DOI: 10.1126/science.159.3810.56.
Nu Holdings Ltd. (2026, March). Company disclosure: Nu surpasses 115 million customers in Brazil. Nu International newsroom and SEC Form 6-K filings, https://international.nubank.com.br/company/nubank-celebrates-two-years-of-ipo-with-significant-growth-and-expansion-into-new-markets/.
Romaniuk, J., & Sharp, B. (2022). How Brands Grow: Part 2 (rev. ed.). Oxford University Press.
Sharp, B. (2010). How Brands Grow: What Marketers Don’t Know. Oxford University Press.
Sun, et al. (2024). Quantifying Reliance on External Information over Parametric Knowledge during Retrieval-Augmented Generation (RAG) Using Mechanistic Analysis. arXiv:2410.00857.
Vishwakarma, R., Kumar, S., & Jamidar, R. (2026). What Gets Cited: Competitive GEO in AI Answer Engines. arXiv:2605.25517.
Yang, K.-C. (2025). News Source Citing Patterns in AI Search Systems. arXiv:2507.05301.
Ye, H., Mao, J., Guan, Z., & Tian, Z. (2026). EcoGEO: Trajectory-Aware Evidence Ecosystems for Web-Enabled LLM Search Agents. arXiv:2605.12887.
Zhang, et al. (2025). Source Coverage and Citation Bias in LLM-based vs. Traditional Search Engines. arXiv:2512.09483.
Zhong, et al. (2026). AutoGEO: What Generative Search Engines Like and How to Optimize Web Content Cooperatively. ICLR 2026. arXiv:2510.11438.
(2025). The Matthew Effect of AI Programming Assistants. arXiv:2509.23261.
(2025). AI Answer Engine Citation Behavior: An Empirical Analysis of the GEO-16 Framework. arXiv:2509.10762.